Data Visualisation
Main functions for creating visualisations of AvaFrame simulation results can be found in
out3Plot and out1Peak.
com1DFA also offers the possibility to export data on particle properties for visualisation
using the open-source application ParaView.
In order to start analysing particle data of com1DFA, follow these steps:
in your local copy of com1DFA/com1DFACfg.ini:
section [GENERAL]: add particles to the resType
section [GENERAL]: set which time steps you want to save at tSteps
section [VISUALISATION]: set writePartToCSV = True and add the particles’ properties you are interested in to the particleProperties
in ParaView
open the particles file located in data/avaDir/Outputs/com1DFA/particlesCSV - there will be one available for each simulation performed containing the info on all saving time steps
apply the filter TableToPoints and set X, Y, Z for the X, Y, Z columns
switch to the RenderView: you can look at all the different particle properties you have saved for all exported time steps
it is also possible to save an animation over all time steps
Gallery
This page contains example plots and pointers to the relevant plotting functions/modules. This is more to show which type of plots exists, not to show all available plots!
Currently work in progress

|

|
|
DEM plot; runscripts/runPlotTopo.py |
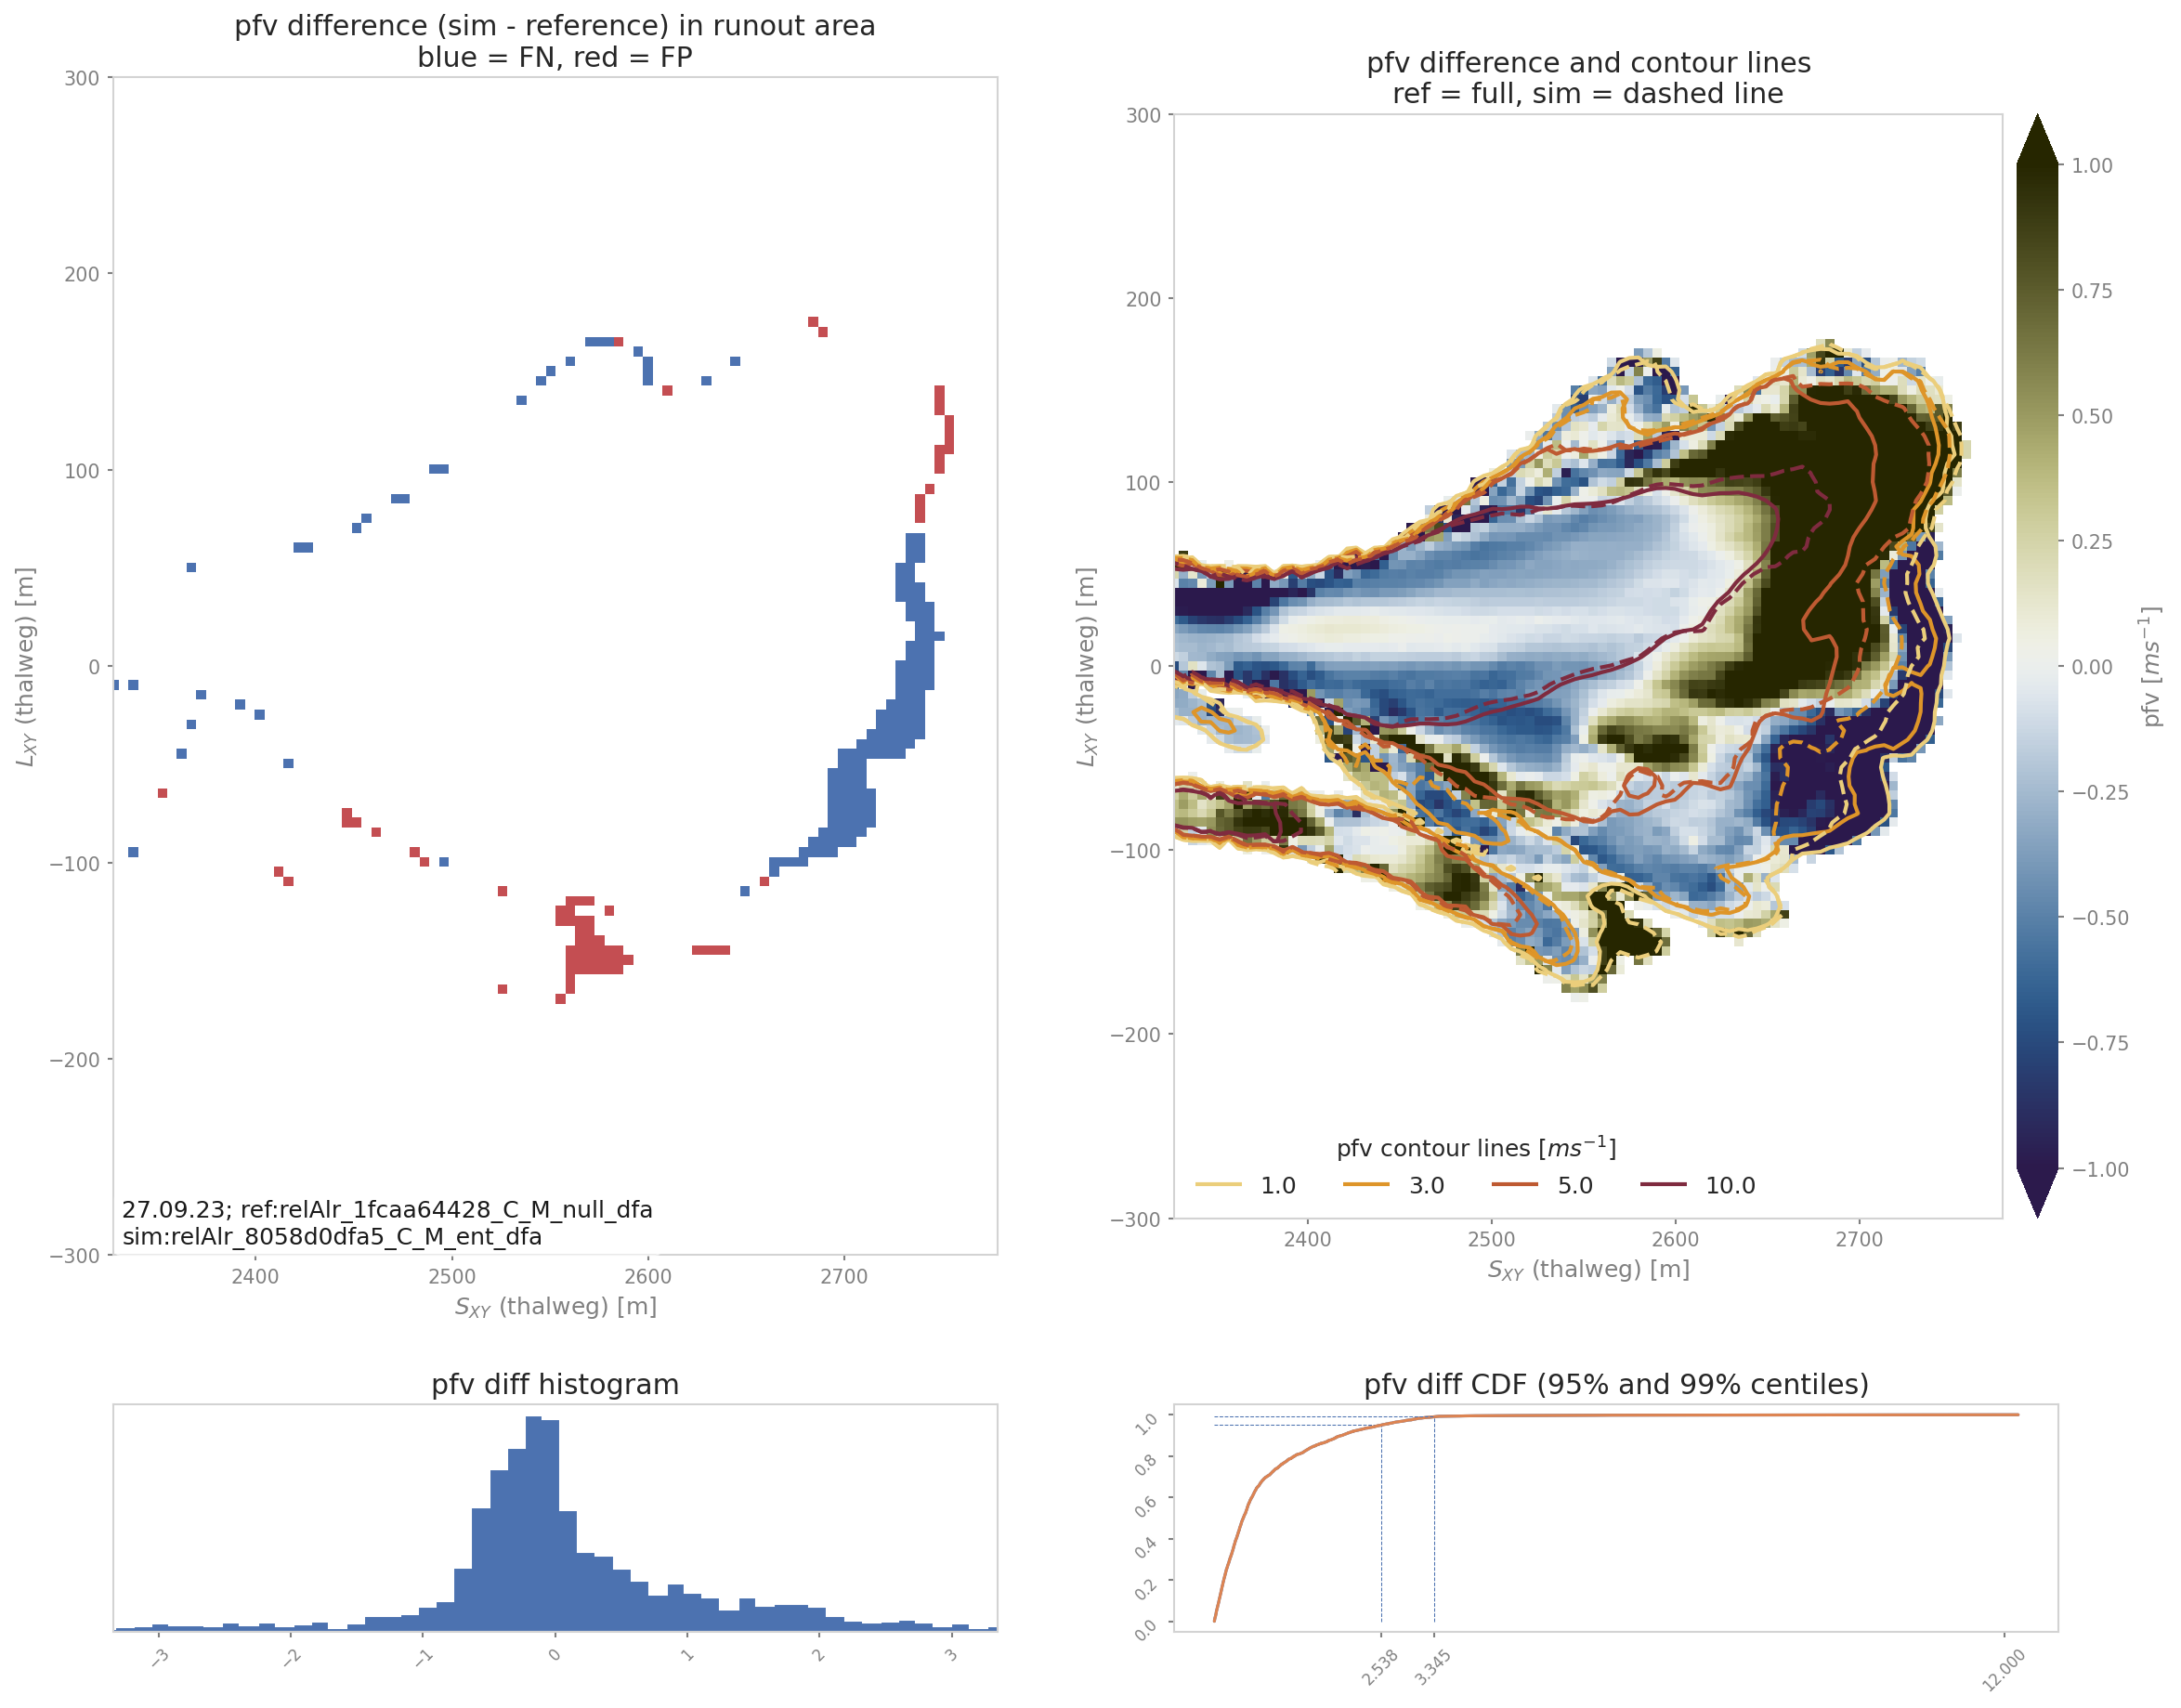
Contour comparison; ana3Aimec/ |
|

|

|

|
Runout line comparison |
Variable comparison |
Thalweg time |

|

|
|
Velocity along thalweg; outAIMEC -> plotVelThAlongThalweg |
Profil along given line; out3Plot -> outProfilePlots |